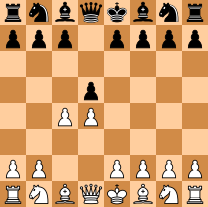
The Republic of Queens Gambit
Chess Openings
Region: Giovanniland
Quicksearch Query: Queens Gambit
|
Quicksearch: | |
NS Economy Mobile Home |
Regions Search |
Queens Gambit NS Page |
|
| GDP Leaders | Export Leaders | Interesting Places BIG Populations | Most Worked | | Militaristic States | Police States | |
| Queens Gambit Domestic Statistics | |||
|---|---|---|---|
| Government Category: | Republic | ||
| Government Priority: | Defence | ||
| Economic Rating: | Frightening | ||
| Civil Rights Rating: | Unheard Of | ||
| Political Freedoms: | Few | ||
| Income Tax Rate: | 52% | ||
| Consumer Confidence Rate: | 96% | ||
| Worker Enthusiasm Rate: | 97% | ||
| Major Industry: | Arms Manufacturing | ||
| National Animal: | king | ||
| Queens Gambit Demographics | |||
| Total Population: | 7,225,000,000 | ||
| Criminals: | 568,511,799 | ||
| Elderly, Disabled, & Retirees: | 872,575,072 | ||
| Military & Reserves: ? | 462,876,148 | ||
| Students and Youth: | 1,325,065,000 | ||
| Unemployed but Able: | 952,210,641 | ||
| Working Class: | 3,043,761,339 | ||
| Queens Gambit Government Budget Details | |||
| Government Budget: | $138,989,119,915,708.91 | ||
| Government Expenditures: | $127,869,990,322,452.20 | ||
| Goverment Waste: | $11,119,129,593,256.70 | ||
| Goverment Efficiency: | 92% | ||
| Queens Gambit Government Spending Breakdown: | |||
| Administration: | $17,901,798,645,143.31 | 14% | |
| Social Welfare: | $8,950,899,322,571.65 | 7% | |
| Healthcare: | $8,950,899,322,571.65 | 7% | |
| Education: | $11,508,299,129,020.70 | 9% | |
| Religion & Spirituality: | $2,557,399,806,449.04 | 2% | |
| Defense: | $28,131,397,870,939.48 | 22% | |
| Law & Order: | $19,180,498,548,367.83 | 15% | |
| Commerce: | $14,065,698,935,469.74 | 11% | |
| Public Transport: | $3,836,099,709,673.57 | 3% | |
| The Environment: | $6,393,499,516,122.61 | 5% | |
| Social Equality: | $6,393,499,516,122.61 | 5% | |
| Queens GambitWhite Market Economic Statistics ? | |||
| Gross Domestic Product: | $102,106,000,000,000.00 | ||
| GDP Per Capita: | $14,132.32 | ||
| Average Salary Per Employee: | $20,304.72 | ||
| Unemployment Rate: | 13.33% | ||
| Consumption: | $113,262,104,747,704.31 | ||
| Exports: | $30,174,931,714,048.00 | ||
| Imports: | $31,398,708,641,792.00 | ||
| Trade Net: | -1,223,776,927,744.00 | ||
| Queens Gambit Non Market Statistics ? Evasion, Black Market, Barter & Crime | |||
| Black & Grey Markets Combined: | $398,594,751,098,561.00 | ||
| Avg Annual Criminal's Income / Savings: ? | $62,824.33 | ||
| Recovered Product + Fines & Fees: | $44,841,909,498,588.11 | ||
| Black Market & Non Monetary Trade: | |||
| Guns & Weapons: | $22,684,400,967,598.26 | ||
| Drugs and Pharmaceuticals: | $12,602,444,981,999.03 | ||
| Extortion & Blackmail: | $25,204,889,963,998.07 | ||
| Counterfeit Goods: | $37,303,237,146,717.14 | ||
| Trafficking & Intl Sales: | $6,553,271,390,639.50 | ||
| Theft & Disappearance: | $12,098,347,182,719.07 | ||
| Counterfeit Currency & Instruments : | $40,327,823,942,396.91 | ||
| Illegal Mining, Logging, and Hunting : | $6,553,271,390,639.50 | ||
| Basic Necessitites : | $14,114,738,379,838.92 | ||
| School Loan Fraud : | $11,594,249,383,439.11 | ||
| Tax Evasion + Barter Trade : | $171,395,742,972,381.22 | ||
| Queens Gambit Total Market Statistics ? | |||
| National Currency: | pawn | ||
| Exchange Rates: | 1 pawn = $1.11 | ||
| $1 = 0.90 pawns | |||
| Regional Exchange Rates | |||
| Gross Domestic Product: | $102,106,000,000,000.00 - 20% | ||
| Black & Grey Markets Combined: | $398,594,751,098,561.00 - 80% | ||
| Real Total Economy: | $500,700,751,098,561.00 | ||
| Giovanniland Economic Statistics & Links | |||
| Gross Regional Product: | $97,561,212,920,791,040 | ||
| Region Wide Imports: | $12,476,135,891,795,968 | ||
| Largest Regional GDP: | GiovanniCards | ||
| Largest Regional Importer: | GiovanniCards | ||
| Regional Search Functions: | All Giovanniland Nations. | ||
| Regional Nations by GDP | Regional Trading Leaders | |||
| Regional Exchange Rates | WA Members | |||
| Returns to standard Version: | FAQ | About | About | 483,866,950 uses since September 1, 2011. | |
Version 3.69 HTML4. V 0.7 is HTML1. |
Like our Calculator? Tell your friends for us... |